EUDR False Positives: What to Do When Satellite Data Flags a Plot
Published
, 12 minute read
Share this article
Quick summary: Learn how EU importers and operators can investigate EUDR satellite alerts, validate plot geolocation, compare forest datasets and document defensible due diligence decisions.
EUDR False Positives can lead to unnecessary supplier investigations, delayed procurement decisions and additional compliance costs, making accurate satellite-based deforestation screening and risk assessment essential for businesses managing complex supply chains. Satellite monitoring has become an important source of evidence for businesses preparing for the EU Deforestation Regulation (EUDR). It can help teams identify possible forest loss around a production plot and focus their attention where further checks may be needed. But an alert is not, by itself, a complete compliance decision.
A flagged plot may require closer examination because of an inaccurate boundary, inconsistent datasets, cloud cover or gaps in historical imagery. Equally, the absence of an alert does not prove that a plot is compliant. Businesses need to evaluate the satellite signal alongside plot information, supplier evidence and the wider due diligence context.
For EU importers and operators, the practical question is not simply, “Did the system flag this plot?” It is: “What does the evidence show, what remains uncertain, and can we explain how we reached our conclusion?”
Key Takeaways
A satellite alert does not automatically mean non-compliance: Satellite monitoring may flag changes in forest cover, but an alert alone does not establish that deforestation has occurred or that a plot violates EUDR requirements.
Validate before making procurement decisions: Businesses should investigate flagged plots before rejecting suppliers or excluding them from their supply chains.
Understand the reason behind the alert: Tree-cover changes may result from different activities or events, including agricultural expansion, harvesting, natural disturbances or data-related limitations. The underlying cause needs to be assessed.
Use plot-level evidence for verification: Review plot boundaries, satellite imagery, historical land-cover information and supporting documents to understand the flagged change.
Consider the EUDR cut-off date: The assessment must establish whether relevant deforestation occurred after 31 December 2020. Historical evidence is essential to this evaluation.
Combine satellite monitoring with ground-level verification: Supplier information, field assessments and other reliable evidence can help clarify alerts that satellite data alone cannot conclusively explain.
Maintain an audit trail: Document the alert, investigation, evidence reviewed, findings and final decision to support transparent and consistent risk assessment.
Avoid treating every alert as a confirmed violation: A structured verification process helps reduce unnecessary supplier rejections, procurement delays and compliance costs while ensuring genuine risks receive appropriate attention.
Download our eBook
Assess your EUDR readiness, uncover data gaps, and take proactive steps towards stronger compliance.
What does a false positive mean in an EUDR assessment?
In this context, a false positive is an alert that initially suggests possible deforestation or forest degradation but, after further investigation, is not supported as evidence of the relevant non-compliant activity. For example, a change detected in imagery might relate to a plot-boundary error or a feature that the monitoring method has misclassified.
The term should be used carefully. A business should not label an alert a false positive simply because another dataset does not show the same change or because a supplier disputes it. The conclusion should follow from a documented review of reliable, relevant evidence. Where the evidence remains inconclusive, the uncertainty should be recorded and investigated further rather than assumed away.
Why satellite alerts can be difficult to interpret
1. Geolocation and polygon errors
Coordinates can be misplaced, polygon boundaries can be drawn inaccurately, and uploaded geometries can contain errors. A small shift may cause monitoring to evaluate the wrong area or include nearby land. Validate the plot’s coordinates, perimeter and geometry before interpreting the alert.
Read our guide to avoid common geolocation errors and ensure your plot data is ready for EUDR assessment.
Satellite products differ in resolution, observation dates, classification methods and the phenomena they are designed to detect. One dataset may identify a change that another does not. Differences are a reason to investigate the methods, dates and spatial coverage—not a reason to select whichever result is more convenient.
Discover how combining satellite intelligence with geolocation data and supplier information can help businesses identify potential risks, investigate alerts and strengthen their due diligence process.
The EUDR deforestation-free criterion is tied to the cutoff date of 31 December 2020. Teams need to understand when the relevant change occurred, not merely whether a satellite product reports a change. Historical imagery may be incomplete, obscured or difficult to interpret, so the timeline should be assessed using suitable evidence and the applicable legal definitions.
4. Land cover can be misinterpreted
Seasonal crop cycles, plantation management, agroforestry, temporary disturbance and other land-cover changes can complicate image interpretation. These factors do not automatically establish compliance. They are context to test against the actual plot, production history and relevant EUDR requirements.
5. Supplier evidence may be incomplete
A supplier may provide a written explanation, photographs or land records, but the business still needs to assess whether that material is relevant, credible and consistent with other evidence. An unsupported assurance should not replace verification.
Discover how a structured risk assessment approach can help businesses identify potential red flags, investigate concerns and determine appropriate risk mitigation measures.
A practical five-step process for investigating an alert
Step 1: Verify the plot geolocation
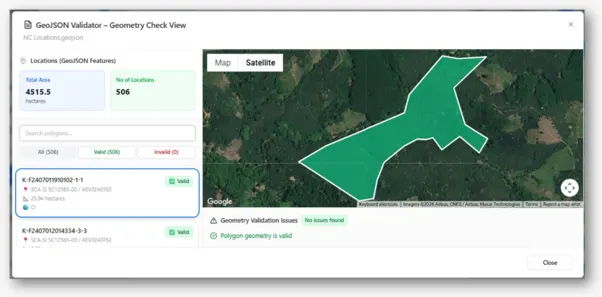
Confirm that the plot belongs to the supplier and commodity being assessed. Check the coordinates, polygon perimeter, geometry validity and any available mapping source. Confirm that the monitored area matches the production plot rather than adjacent land. If an error is identified, correct it through a controlled process and retain a record of the original data and correction.
TraceX Automatically validates and repairs plot boundaries, detects duplicates, standardises WGS84 coordinates, verifies actual plot area and flags unreliable or invalid geolocations. It also checks whether plots are geographically and agriculturally plausible, identifying issues such as urban locations, water bodies, unsuitable elevations and missing vegetation—with clear reasons for correction before submission.
Step 2: Compare relevant forest datasets and imagery
Review the source, date, resolution and methodology behind the alert. Where appropriate, compare independent datasets or imagery from multiple dates. Look for whether the apparent change is persistent, where it occurs relative to the plot boundary, and whether the available imagery supports the initial interpretation. Record both corroborating and conflicting evidence.
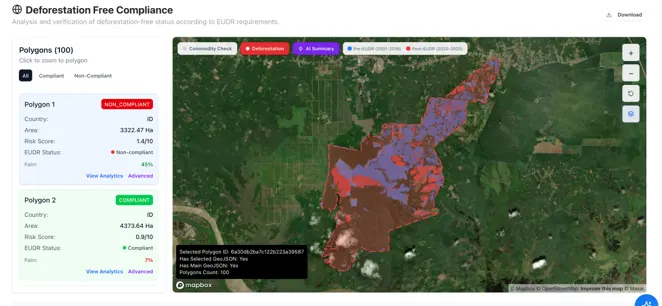
Combines multiple independent global, national and TraceX satellite data sources to assess each plot, flagging non-compliance only when multiple sources agree to reduce false positives. It distinguishes tree-crop plantations and established farmland from forest conversion, enabling more accurate deforestation risk assessments.
Step 3: Test the timeline against 31 December 2020
Build a timeline from the available historical evidence. Distinguish a detected change from a conclusion about when it occurred and what it represents. If the dates cannot be established confidently, document that limitation and identify what additional evidence or expert review is needed.
TraceX Provides transparent, plot-level assessment reports explaining the decision rules, evidence, satellite imagery, yearly clearance maps and reasons for false-positive dismissals, with PDF exports for auditors and buyers. It preserves submitted boundaries, dataset versions and assessment engine versions to ensure results are reproducible, supporting the five-year record-retention requirement.
Step 4: Request and verify supporting supplier evidence
Ask the supplier for relevant plot history, production information, land-use records, dated photographs, field observations or other supporting material. Assess whether the evidence relates to the exact plot and relevant period. Where warranted, consider independent technical review or field verification. Keep the request, response and assessment together.
Step 5: Document the assessment, mitigation and conclusion
Record the original alert, datasets reviewed, geolocation checks, supplier responses, evidence gaps, corrections, reviewers and reasons for the conclusion. If the assessment identifies risk, determine and document appropriate risk-mitigation measures. Reassess when new evidence materially changes the picture. Preserve the history rather than simply deleting an alert or overwriting an earlier result.
Hypothetical example: A rubber plot flagged in Southeast Asia
An EU importer is assessing a shipment of natural rubber. A satellite monitoring tool flags a supplier’s plot in Southeast Asia for possible forest loss. A second dataset shows a different pattern, and the initial alert appears close to the plot boundary.
The importer does not immediately reject the plot, and it does not dismiss the alert. The team first validates the polygon and finds that a section of the submitted boundary may include adjacent land. It checks the geometry and compares the alert with imagery from multiple dates. The team then asks the supplier for plot-specific production history and dated supporting records. The evidence helps explain part of the discrepancy, but one period remains uncertain.
The importer records the original alert, the boundary issue, the datasets reviewed, the supplier’s response and the remaining evidence gap. The team seeks additional review before reaching a conclusion. If the evidence ultimately supports that the alert was not evidence of relevant non-compliant activity, the rationale and supporting documents are retained. If the uncertainty cannot be resolved, the business does not treat the plot as cleared merely because one source looks reassuring.
The lesson is simple: the defensibility of the decision comes from the quality and traceability of the investigationnot from whether the first alert was red or green.
What to do when an alert is confirmed to be a false positive
Record the reason the alert was considered a false positive and link the conclusion to supporting evidence.
Correct plot geometry or underlying data when an error is confirmed; preserve the original version and change history.
Request additional supplier information when needed and document how it was verified.
Keep the original alert, review notes, data sources and investigation history rather than deleting the alert.
Reassess the plot and document the final risk conclusion before relying on it in the relevant due diligence decision.
Common mistakes to avoid
Automatically rejecting a plot based on a single alert without checking its context.
Ignoring an alert because another dataset does not show the same result.
Accepting a supplier explanation without verifying its relevance and supporting evidence.
Correcting data while losing the original alert or investigation history.
Treating a green software status as proof that all due diligence requirements have been met.
A sound process avoids both extremes: it neither treats every alert as conclusive proof of non-compliance nor assumes that a conflicting result makes the alert irrelevant.
How EUDR software can help—and what it cannot replace
Software can make the investigation more consistent and explainable when it connects plot data, satellite evidence, supplier information and decisions in one workflow. Useful capabilities include:
Plot geolocation validation to identify geometry and boundary issues before the evidence is interpreted.
Satellite monitoring and dataset comparison to help teams review alerts and the relevant historical context.
Centralised evidence management to connect supplier documents, plot records, findings and mitigation actions.
A shipment-specific audit trail showing the alert, investigation, supporting evidence, changes and rationale behind the conclusion.
These capabilities support the due diligence process; they do not replace the operator’s responsibility to assess the evidence, make the required decisions and apply appropriate risk mitigation. A risk score or automated status is an input to the assessment, not a substitute for it.
A checklist for compliance and sustainability teams
Have we confirmed that the coordinates and polygon correspond to the correct production plot?
Do we understand the source, date and limitations of the satellite alert?
Have we reviewed relevant datasets and historical imagery where appropriate?
Have we assessed the timeline against the 31 December 2020 cutoff and applicable EUDR criteria?
Have we requested and evaluated plot-specific supplier evidence where needed?
Are unresolved uncertainties clearly recorded and assigned for follow-up?
Can we show the original alert, evidence reviewed, corrections, mitigation and reason for the conclusion?
Can we trace the plot assessment to the relevant supplier, commodity and shipment?
How TraceX can support the process
TraceX EUDR Solutions helps businesses connect plot-level geolocation, satellite monitoring, supplier evidence and traceability records so that an alert can be investigated within a structured workflow. Centralised evidence and a shipment-specific audit trail can help teams retain the context behind a decision and make their assessment easier to review.
The objective is not simply to detect a possible issue. It is to help the business organise the evidence, investigate the signal, document the rationale and understand what still needs to be resolved. Technology can make this work more manageable, but the due diligence decision remains the responsibility of the relevant business.
Evaluating software?
See how plot validation, satellite monitoring, centralised evidence and shipment-specific audit trails can support your workflow.
Does a satellite alert automatically mean a plot is non-compliant with the EUDR?
No. An alert is a signal that may require investigation. The business must assess relevant information and evidence in context. It should neither assume that every alert proves non-compliance nor dismiss an alert without adequate review.
What should an importer check first when a plot is flagged?
Start by confirming the plot’s coordinates and polygon boundary, then review the alert’s source, date and spatial coverage. Continue with relevant imagery, supplier evidence and a documented assessment of any remaining uncertainty.
Why can two satellite datasets show different results?
Datasets may use different resolutions, observation periods, classification methods and detection approaches. Compare their methods and underlying evidence rather than choosing a result solely because it is more favourable.
How should a confirmed false positive be documented?
Retain the original alert, evidence sources, geolocation checks, supplier responses, corrections and reasoning supporting the conclusion. Keep the investigation history so a reviewer can understand how the decision was reached.
Can EUDR software replace due diligence?
No. Software can organise data, flag potential issues and support evidence review. It does not replace the operator’s obligation to assess information, determine risk and implement mitigation where required.
Start using TraceX
Transparency, Trust, & Success for your Climate Journey.
We use cookies on our website to give you the most relevant experience by remembering your preferences and repeat visits. By clicking “Accept All”, you consent to the use of ALL the cookies. However, you may visit "Cookie Settings" to provide a controlled consent.
This website uses cookies to improve your experience while you navigate through the website. Out of these, the cookies that are categorized as necessary are stored on your browser as they are essential for the working of basic functionalities of the website. We also use third-party cookies that help us analyze and understand how you use this website. These cookies will be stored in your browser only with your consent. You also have the option to opt-out of these cookies. But opting out of some of these cookies may affect your browsing experience.
Necessary cookies are absolutely essential for the website to function properly. These cookies ensure basic functionalities and security features of the website, anonymously.
Cookie
Duration
Description
cookielawinfo-checkbox-analytics
11 months
This cookie is set by GDPR Cookie Consent plugin. The cookie is used to store the user consent for the cookies in the category "Analytics".
cookielawinfo-checkbox-functional
11 months
The cookie is set by GDPR cookie consent to record the user consent for the cookies in the category "Functional".
cookielawinfo-checkbox-necessary
11 months
This cookie is set by GDPR Cookie Consent plugin. The cookies is used to store the user consent for the cookies in the category "Necessary".
cookielawinfo-checkbox-others
11 months
This cookie is set by GDPR Cookie Consent plugin. The cookie is used to store the user consent for the cookies in the category "Other.
cookielawinfo-checkbox-performance
11 months
This cookie is set by GDPR Cookie Consent plugin. The cookie is used to store the user consent for the cookies in the category "Performance".
viewed_cookie_policy
11 months
The cookie is set by the GDPR Cookie Consent plugin and is used to store whether or not user has consented to the use of cookies. It does not store any personal data.
Functional cookies help to perform certain functionalities like sharing the content of the website on social media platforms, collect feedbacks, and other third-party features.
Performance cookies are used to understand and analyze the key performance indexes of the website which helps in delivering a better user experience for the visitors.
Analytical cookies are used to understand how visitors interact with the website. These cookies help provide information on metrics the number of visitors, bounce rate, traffic source, etc.
Advertisement cookies are used to provide visitors with relevant ads and marketing campaigns. These cookies track visitors across websites and collect information to provide customized ads.