Satellite Monitoring for EUDR: Turning Alerts Into Audit-Proof Evidence
Published
, 9 minute read
Share this article
Quick summary: Satellite monitoring for EUDR must prove a negative against a fixed 2020 baseline. See how multi-source imagery clears false positives before they block clean shipments.
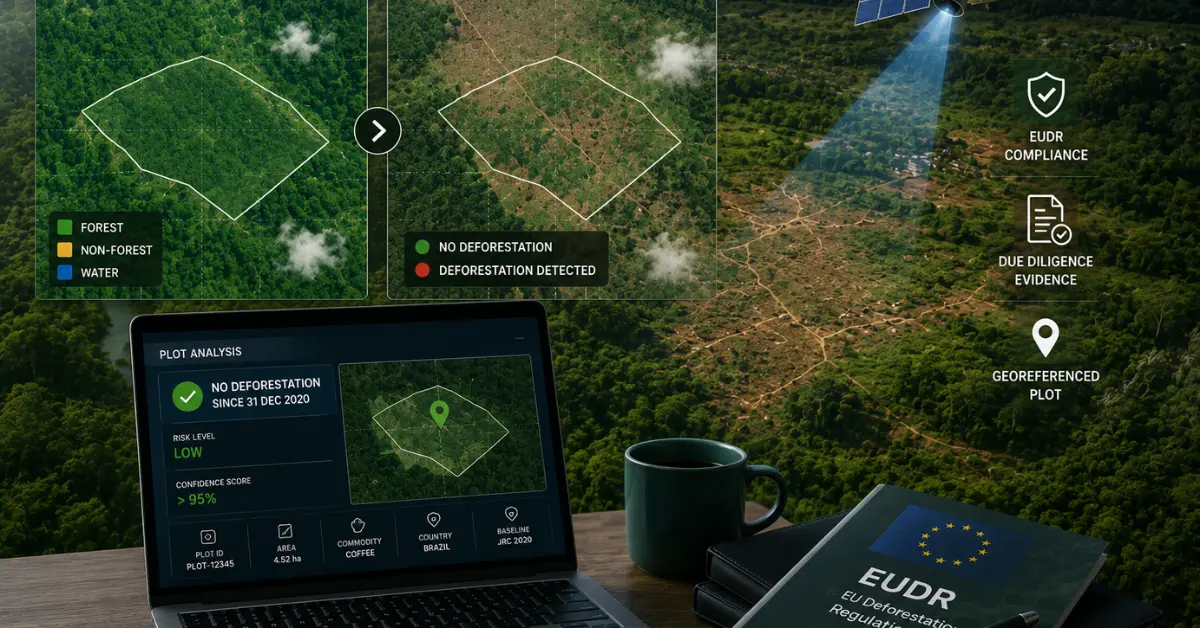
Satellite monitoring for EUDR compares each production plot against the EU’s forest-cover baseline for 31 December 2020 (the JRC Global Forest Cover map) and screens it for any deforestation since. The regulation puts the burden of proof on the operator, so a satellite alert is a prompt to investigate, not a verdict the JRC baseline is deliberately built to over-flag. Reliable monitoring therefore combines the 2020 baseline with radar alerts (RADD, which sees through tropical cloud) and optical alerts (GLAD-S2), plus high-resolution imagery and ground data, to clear false positives and confirm real deforestation with a dated, plot-level evidence trail.
Key Takeaways
It’s an evidence system, not an alarm. The EUDR makes you prove a negative against a fixed 2020 baseline. Satellite monitoring for EUDR exists to build defensible, dated, per-plot proof not just to raise flags.
The official baseline over-flags on purpose. The JRC 2020 map is designed to produce more false positives than false negatives as a first filter, shifting verification onto you.
One sensor is never enough. Optical imagery goes blind under tropical cloud and mistakes agroforestry for forest; radar (RADD) sees through cloud. Convergence of sources is the standard.
False positives block clean shipments. In some regions a majority of smallholder plots overlap ‘forest’ on the 2020 map without evidence to clear them, compliant farmers get shut out of the EU.
Don’t let a false alert block a compliant shipment.
See how TraceX layers the JRC 2020 baseline, radar and optical alerts, and ground data into one plot-level evidence trail.
Satellite Monitoring for EUDR: What It Actually Has to Prove
Satellite monitoring for EUDR is the use of earth-observation imagery to prove that a production plot was not deforested after 31 December 2020 the fixed cut-off written into the EU Deforestation Regulation. In plain terms, you are using satellites to demonstrate a negative: that the land behind every commodity batch has stayed deforestation-free since that date, and that any recent change on it is not illegal clearing.
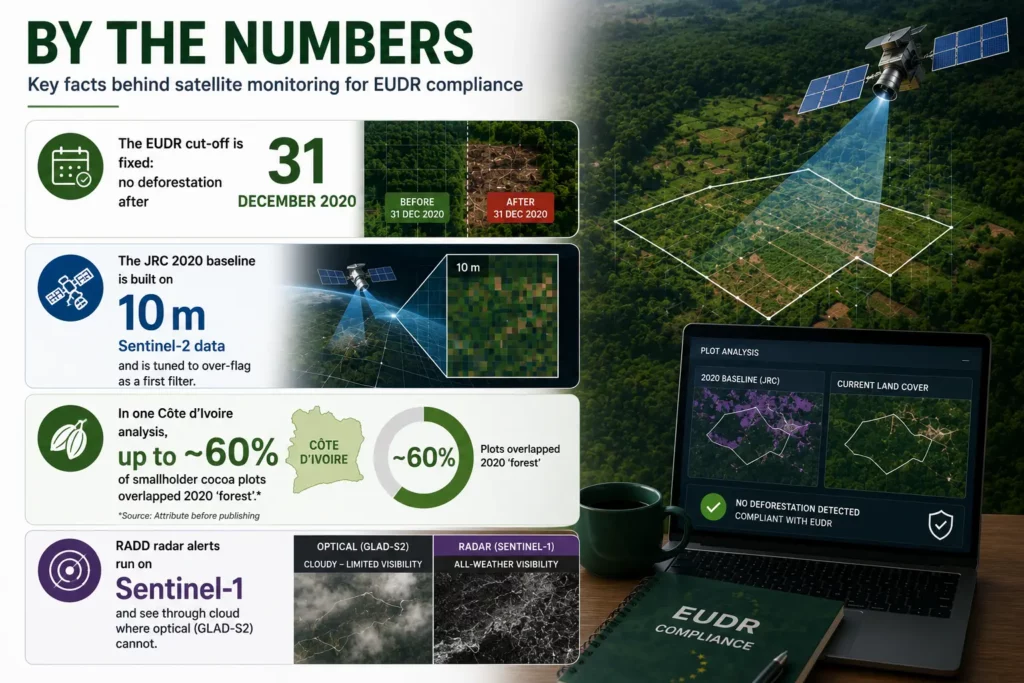
The reference point is the EU Forest Observatory’s Global Forest Cover map for 2020 (GFC2020), produced by the European Commission’s Joint Research Centre (JRC) from 10-metre Sentinel-2 data. It is the snapshot of what counted as forest on the cut-off date. The EUDR doesn’t name a satellite vendor but because you must prove deforestation-free status and run a documented risk assessment under Articles 9 to 11, satellite monitoring for EUDR is effectively unavoidable. The obligation lands on operators from 30 December 2026, and on micro and small operators from 30 June 2027.
Why Satellite Monitoring for EUDR Is Evidence, Not an Alarm
Most write-ups sell satellites as a way to “catch deforestation in real time.” That misreads how the regulation actually works. The JRC has been explicit that its 2020 map is tuned to over-flag to produce more false positives than false negatives on purpose so that risky areas surface for a closer look. It is a first filter, not a ruling. From a regulator’s seat that’s sensible; from an operator’s seat it means a raw alert is a question you have to answer, with the burden of proof on you.
That single design choice reframes satellite monitoring for EUDR. Its real job isn’t to sound alarms; it’s to produce the evidence that clears or confirms them. And because “deforestation-free” is pinned to a fixed date, half of that work is historical: proving what a plot was on 31 December 2020, not just watching what it is today. Operators who pour everything into live alerting and neglect baseline proof end up unable to defend a challenge on the one date that matters.
So the useful question when evaluating any tool is not “how fast does it alert?” but “can it produce a dated, plot-level record that survives a competent authority’s challenge?” That is the bar satellite monitoring for EUDR has to clear.
Satellite Monitoring for EUDR in the Real World: Where Single Sources Fail
These illustrative field scenarios show why a single data source can’t carry EUDR compliance and what closes the gap.
The smallholder plots that overlap ‘forest’
In parts of Côte d’Ivoire, one industry analysis of roughly 1.1 million cocoa plots found that up to ~60% overlapped land the 2020 map labelled ‘forest.’ Routine pruning or replanting on those plots then reads as deforestation, and compliant smallholders get excluded from the EU on false grounds. What closes it: a higher-resolution baseline and plot context that separates cocoa agroforestry from natural forest, plus evidence to clear the flag.
The region under monsoon cloud
Optical satellites can’t see through cloud, and tropical sourcing regions can stay clouded for months. A palm or cocoa area monitored with optical data alone shows long ‘no-data’ gaps that look like blind spots to an auditor. What closes it: radar (Sentinel-1 / RADD alerts), which penetrates cloud and keeps monitoring continuous when optical goes dark.
The agroforestry farm flagged as cleared
Shade-grown coffee under a tree canopy can register as forest; a legitimate thinning or harvest cycle then trips a deforestation alert. Acting on that raw flag would wrongly block a compliant farm. What closes it: very-high-resolution imagery plus a ground-truth check to confirm the land use before any decision.
The authority that questions the 2020 baseline
A competent authority asks an operator to show a plot was not forest before the cut-off. With only live alerts on file, there’s nothing to answer with. What closes it: an archived 2020 Sentinel-2 mosaic for that exact polygon, showing it was already cropland the difference between clearing a query in minutes and losing a shipment.
Satellite Monitoring for EUDR That Holds Up to an Audit
The fix is convergence: no single layer decides compliance, and every decision leaves a record. A platform built for satellite monitoring for EUDR should do six things.
Anchor to the JRC 2020 baseline. Screen every plot against the official Global Forest Cover 2020 layer so your ‘deforestation-free’ claim is measured against the same reference the regulator uses.
Combine radar and optical. Layer RADD (Sentinel-1 radar) with GLAD-S2 (Sentinel-2 optical) so cloud cover never creates a blind spot and alerts cross-check each other.
Add high-resolution and ground-truth. Escalate flagged plots to very-high-resolution imagery and field verification, so agroforestry and smallholder plots aren’t rejected on false positives.
Keep a dated, per-plot evidence trail. Store the imagery, source and date behind every clear-or-confirm decision, so any plot can answer an audit query on demand.
Run convergence-of-evidence, not one dataset. Cross-validate multiple layers rather than trusting a single map.
Feed results straight into the DDS. Push each plot’s verified status into the Due Diligence Statement for the EUDR Information System, so monitoring and filing are one workflow, not two.
Learn how organizations can identify, assess, and document deforestation risks using geospatial data, supplier due diligence, and evidence-based workflows to support EUDR compliance.
Satellite Monitoring for EUDR: Data Sources at a Glance
No single layer answers every question. This is how the main sources fit together.
Data source
Sensor / resolution
What it’s best for — and its limit
JRC GFC2020 v2 (baseline)
Sentinel-2 optical, 10 m, 2020 snapshot
The official 2020 forest reference. Over-flags by design treat as a first filter, not a verdict.
RADD alerts
Sentinel-1 radar, near-real-time
Sees through tropical cloud; best for continuous monitoring where optical goes blind.
GLAD-S2 alerts
Sentinel-2 optical, 10 m, near-real-time
Near-real-time forest-loss detection; blocked by persistent cloud cover.
Very-high-resolution (VHR)
Optical, sub-metre
Confirming small agroforestry and smallholder plots; clears false positives. Cost/tasking limited.
WHISP (FAO)
Convergence of multiple layers
Free cross-validation of GFC, RADD, TMF and crop maps for preliminary due diligence.
TraceX Satellite Monitoring Solutions
TraceX EUDR Solutions help organizations continuously monitor sourcing locations for deforestation risks using advanced geospatial intelligence and multi-source satellite data. Instead of relying on a single satellite image or forest-loss dataset, TraceX combines historical imagery, forest and land-use classification, change detection, commodity-specific analysis, and legal risk overlays to deliver accurate, audit-ready assessments.
The platform distinguishes genuine deforestation from legitimate land-use activities such as plantation harvesting, agricultural rotation, and agroforestry, reducing false positives while improving assessment accuracy. It also evaluates sourcing locations against protected areas, indigenous territories, wetlands, and other legal and environmental datasets to strengthen due diligence.
Built to support EUDR compliance, TraceX enables organizations to continuously monitor production plots, identify potential deforestation events, maintain evidence-backed risk assessments, and generate audit-ready reports. By combining satellite intelligence with geospatial analytics and commodity-specific logic, TraceX helps businesses make confident sourcing decisions and demonstrate robust, defensible due diligence across their supply chains.
Turn satellite monitoring for EUDR into proof, not guesswork.
TraceX anchors every plot to the JRC 2020 baseline, combines radar and optical alerts with ground data, and keeps a dated evidence trail that feeds straight into your DDS.
Satellite Monitoring for EUDR: Buyer Readiness Checklist
Before you trust a tool to defend your deforestation-free claim, confirm every box.
✓Screens every plot against the JRC Global Forest Cover 2020 baseline.
✓Combines radar (RADD) and optical (GLAD-S2) so cloud never leaves a blind spot.
✓Escalates flagged plots to high-resolution imagery and ground-truth checks.
✓Distinguishes agroforestry and smallholder plots from natural forest.
✓Keeps a dated, per-plot evidence trail for every clear-or-confirm decision.
✓Cross-validates multiple layers rather than trusting one map.
✓Feeds verified plot status directly into the DDS for the Information System.
Frequently Asked Questions
Does the EUDR require companies to use satellites?
Not a specific provider. It requires operators to prove deforestation-free status after 31 December 2020 and to run risk assessment and mitigation. Satellite monitoring is the practical way to do that and the basis the EU Forest Observatory uses.
What is the 2020 baseline for EUDR?
The EU Forest Observatory’s Global Forest Cover map for 2020 (GFC2020), produced by the JRC from 10 m Sentinel-2 data. It defines what counted as forest on the cut-off date.
Why do satellite alerts produce false positives?
The JRC baseline is tuned to over-flag as a first filter, and optical sensors can mistake agroforestry for forest or lose data under cloud. Alerts must be verified with additional sources and ground data before any decision.
Why combine radar and optical imagery?
Optical imagery is blocked by tropical cloud cover; radar (Sentinel-1 / RADD) sees through it. Using both keeps monitoring continuous and lets the two sources cross-check each other.
How does satellite monitoring connect to the DDS?
Each plot’s verified deforestation-free status becomes evidence in the Due Diligence Statement submitted to the EUDR Information System, so monitoring feeds filing directly.
We use cookies on our website to give you the most relevant experience by remembering your preferences and repeat visits. By clicking “Accept All”, you consent to the use of ALL the cookies. However, you may visit "Cookie Settings" to provide a controlled consent.
This website uses cookies to improve your experience while you navigate through the website. Out of these, the cookies that are categorized as necessary are stored on your browser as they are essential for the working of basic functionalities of the website. We also use third-party cookies that help us analyze and understand how you use this website. These cookies will be stored in your browser only with your consent. You also have the option to opt-out of these cookies. But opting out of some of these cookies may affect your browsing experience.
Necessary cookies are absolutely essential for the website to function properly. These cookies ensure basic functionalities and security features of the website, anonymously.
Cookie
Duration
Description
cookielawinfo-checkbox-analytics
11 months
This cookie is set by GDPR Cookie Consent plugin. The cookie is used to store the user consent for the cookies in the category "Analytics".
cookielawinfo-checkbox-functional
11 months
The cookie is set by GDPR cookie consent to record the user consent for the cookies in the category "Functional".
cookielawinfo-checkbox-necessary
11 months
This cookie is set by GDPR Cookie Consent plugin. The cookies is used to store the user consent for the cookies in the category "Necessary".
cookielawinfo-checkbox-others
11 months
This cookie is set by GDPR Cookie Consent plugin. The cookie is used to store the user consent for the cookies in the category "Other.
cookielawinfo-checkbox-performance
11 months
This cookie is set by GDPR Cookie Consent plugin. The cookie is used to store the user consent for the cookies in the category "Performance".
viewed_cookie_policy
11 months
The cookie is set by the GDPR Cookie Consent plugin and is used to store whether or not user has consented to the use of cookies. It does not store any personal data.
Functional cookies help to perform certain functionalities like sharing the content of the website on social media platforms, collect feedbacks, and other third-party features.
Performance cookies are used to understand and analyze the key performance indexes of the website which helps in delivering a better user experience for the visitors.
Analytical cookies are used to understand how visitors interact with the website. These cookies help provide information on metrics the number of visitors, bounce rate, traffic source, etc.
Advertisement cookies are used to provide visitors with relevant ads and marketing campaigns. These cookies track visitors across websites and collect information to provide customized ads.
Download the 2026 Traceability Scorecard and Benchmark Your Supply Chain Across 10 Critical Capabilities.
Download our eBook
Don’t Wait for an Audit to Find Your EUDR Gaps
The 2026 Simplification Package changes how HS codes, DDS pass-through and geolocation rules apply to you. Get the free guide and 20-point readiness checklist before enforcement catches you unprepared.