Quick summary: Explore how polygon mapping supports climate action by providing accurate tracking, measurement, and reporting for carbon projects, EUDR compliance, and environmental sustainability efforts.

Most climate, compliance, and traceability programs fail for one simple reason: they don’t know exactly where the land is. A single GPS point, a hand-drawn boundary, or a spreadsheet reference might look acceptable on paper, but when carbon claims are audited, or regulations like EUDR are enforced, those shortcuts collapse fast. Polygon mapping fixes this problem at the root.
By capturing the true boundaries of farms, plots, and land parcels, polygon mapping turns vague locations into verifiable spatial evidence. For carbon accounting, it means accurate area calculations and credible sequestration estimates. For compliance, it means defensible land-use verification. For traceability, it means linking products back to real, non-overlapping plots. As carbon markets, ESG reporting, and land-use regulations tighten, polygon mapping is no longer a technical nice-to-have it’s the foundation of trust.
Key Takeaways
Polygon mapping is the process of digitally capturing the exact boundaries of a land parcel using a series of connected GPS coordinates to form a closed shape, or polygon. Unlike a single GPS point, which only marks an approximate location, polygon mapping defines the full area, shape, and extent of a plot, making it suitable for verification, monitoring, and reporting.
The key difference between GPS points and polygon boundaries is accuracy. A point shows where a farm is located, but a polygon shows how much land exists and where it begins and ends. For carbon accounting and regulatory compliance, this distinction is critical. Carbon calculations depend on precise land area, and compliance checks require clear proof that production or restoration activities occur within eligible, non-overlapping boundaries.
Because polygons represent land accurately and unambiguously, they are now the standard for carbon projects, ESG reporting, and regulations like EUDR. In simple terms, polygon mapping is used to define the exact boundaries of a land parcel for verification, monitoring, and reporting, providing the spatial integrity needed to support credible climate and traceability claims.
Read our blog on GIS in Agriculture to see how spatial data underpins carbon accounting, compliance, and modern traceability systems.
Explore our guide on Geographic Coordinates for EUDR to learn how accurate plot-level coordinates reduce DDS rejections and support deforestation-free verification
As land-use regulations and climate disclosure rules become more stringent, polygon mapping has moved from a best practice to a regulatory expectation. For frameworks such as EUDR, SBTi FLAG, and ESG disclosure regimes, compliance increasingly depends on whether land can be spatially verified not just described.
Polygon mapping allows authorities and companies to assess deforestation risk by overlaying precise plot boundaries with satellite imagery and deforestation datasets. Unlike GPS points, polygons make it possible to determine whether any part of a farm or plot overlaps with land deforested after regulatory cut-off dates. This spatial precision is essential for credible deforestation-free claims.
Many regulations and standards require proof that land meets specific eligibility criteria such as historical land use, conservation status, or exclusion from protected areas. Polygon boundaries enable automated and auditable checks against land-use maps, forest cover data, and protected-area databases, reducing ambiguity and enforcement risk.
Under due diligence regimes, companies must demonstrate that sourcing and production are lawful. Polygon mapping links land parcels to legal documents, tenure declarations, and permits, allowing regulators and auditors to verify that production occurs on legitimately used land rather than relying on broad regional assumptions.
Regulators require spatially verifiable plots because land-use impacts cannot be assessed reliably without boundaries. A single coordinate cannot show whether activities extend into forests, conservation zones, or neighbouring land. Polygons provide the transparency regulators need to enforce rules consistently, reduce false declarations, and detect non-compliance using remote sensing and independent data sources.
EUDR explicitly relies on plot-level geolocation to verify that commodities are deforestation-free. Polygon mapping enables accurate deforestation checks, prevents overlap between suppliers, and supports defensible Due Diligence Statements (DDS).
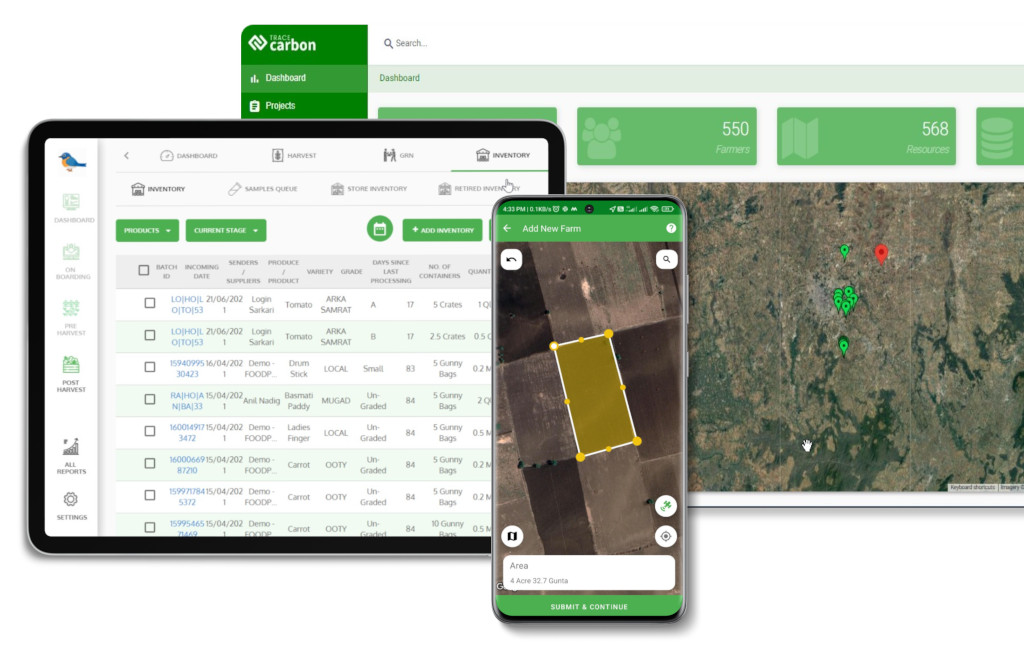
A Nigerian trading company used the polygon mapping feature of TraceX to ensure compliance with the EU Deforestation Regulation (EUDR). By leveraging GPS technology, the company accurately mapped farm boundaries to monitor risks associated with deforestation. The feature flagged areas near protected zones, enabling proactive and responsible land management. It also simplified the mapping process for field officers, ensuring precise boundary delineation and reducing errors, thereby aligning operations with EUDR’s sustainability and traceability standards.
For SBTi FLAG, polygon mapping helps companies understand where land-use emissions and removals occur within their value chains. It supports credible attribution of land-based emissions, removals, and mitigation actions to specific locations rather than generalized supply regions.
Across ESG and sustainability reporting, companies are increasingly required to disclose land footprints, sourcing risk, and land-use impacts. Polygon-based data allows these disclosures to be backed by verifiable spatial evidence, strengthening audit readiness and investor confidence.
In short, polygon mapping is the spatial backbone of modern land-use compliance enabling regulators, companies, and auditors to move from assumptions to evidence.
Effective supply chain traceability depends on one core question: exactly where did this product come from? Polygon mapping provides the spatial precision needed to answer that question with confidence, linking physical goods to verifiable land parcels rather than vague locations or supplier declarations.
Polygon mapping enables a direct connection between mapped farm plots, identified suppliers, and specific product flows. Each polygon can be linked to a farmer profile, production volumes, and harvest periods, and then associated with batches and shipments as products move through the supply chain. This creates a continuous trace from land to logistics, allowing companies to prove origin, manage risk, and respond quickly to audits or buyer inquiries.
Precise plot boundaries play a critical role in preventing common traceability failures:
Polygon mapping is especially important for commodities with elevated land-use and deforestation risk, including coffee, cocoa, palm oil, and rubber. These supply chains often involve thousands of smallholders, multiple intermediaries, and cross-border trade conditions where weak spatial data quickly leads to compliance and market access issues.
In agroforestry and smallholder systems, plots are often small, irregular, and intercropped. Polygon mapping captures this complexity accurately, supporting fair attribution of production and environmental outcomes. It enables traceability systems that reflect real land use, not simplified assumptions, and supports long-term participation by ensuring farmers’ land and contributions are correctly represented.
By grounding traceability in precise land boundaries, polygon mapping turns supply chains from opaque and assumption-driven into transparent, auditable, and resilient systems.
See how boundary overlap detection strengthens carbon project validation
Read the case study on Enhancing Carbon Project Validation with the Boundary Overlap Feature to learn how spatial validation reduced double counting risk, improved verifier confidence, and accelerated carbon credit approval.
Accurate carbon accounting starts with a simple but non-negotiable input: how much land is involved. In land-based climate projects, every carbon estimate, whether for sequestration, removals, or avoided emissions, depends directly on the size, shape, and location of the land being measured. Polygon mapping provides the spatial precision needed to make those estimates credible.
Carbon models calculate biomass growth, soil carbon change, and sequestration rates per unit area. If land area is overstated or understated, carbon outcomes are distorted from the start. Polygon mapping defines the true boundaries of a plot, ensuring that area calculations reflect reality rather than approximations based on a single coordinate or assumption.
Inaccurate boundaries have cascading effects across carbon accounting:
Carbon registries and verifiers increasingly reject point-based mapping because a single GPS point cannot define land area or detect overlap. Points do not show whether carbon activities extend into neighbouring land, protected areas, or previously credited plots. Polygons, by contrast, allow registries to run automated spatial checks against satellite data and other projects, reducing uncertainty and fraud risk.
Without polygon mapping, projects face a high risk of over-crediting (claiming carbon from land that is not actually included) or under-crediting (failing to capture eligible land and sequestration). Both outcomes carry serious consequences over-crediting damages market integrity and invites enforcement action, while under-crediting reduces project revenue and investor confidence.
For buyers, registries, and regulators, polygon mapping is therefore not a technical detail it is the foundation that makes land-based carbon accounting accurate, defensible, and trustworthy.
GPS points and paper maps may work for basic location tracking, but they break down quickly when used for carbon accounting, compliance, or large-scale traceability. As projects grow in size and scrutiny increases, these methods introduce risks that are costly to fix later.
Point-based mapping captures only a single location reference, not the full extent of a land parcel. This leads to several critical problems:
Paper maps and hand-drawn boundaries introduce additional risks. They are often inconsistent, difficult to validate, and nearly impossible to integrate with satellite imagery or digital verification systems. Manual records are prone to loss, transcription errors, and version mismatches, especially in multi-year or multi-country projects.
When mapping errors surface during verification or audits, the cost escalates quickly. Projects may need to remap plots, re-collect farmer data, redo carbon baselines, or delay credit issuance and compliance filings. In some cases, claims are rejected outright. Fixing spatial errors after the fact is far more expensive and disruptive than capturing accurate polygon data from the start making early investment in proper mapping a critical risk-management decision.

Smallholder and agroforestry landscapes are among the most complex environments to map and also the most sensitive to mapping errors. Plots are often small, irregularly shaped, intercropped, and closely adjacent to one another. In these contexts, even minor spatial inaccuracies can create outsized risks for carbon claims, compliance, and long-term project success.
Small plots amplify mapping risk because boundaries are tight and margins for error are minimal. A few meters of inaccuracy can significantly distort plot area, overlap with neighbouring land, or unintentionally include ineligible zones. When thousands of such plots are involved, these small errors compound, increasing the likelihood of overlap, double counting, and verification failure.
Polygon mapping in agroforestry must go beyond basic plot outlines. Capturing functional land features is essential, including:
Mapping these features provides a more accurate representation of how land is managed and how agroforestry systems function in practice.

Accurate polygon mapping strengthens carbon permanence by supporting better assumptions around tree survival, soil stability, and long-term land management. It improves soil and water management by making erosion-control and water-harvesting structures visible and measurable. Over time, this spatial clarity contributes to long-term resilience, helping agroforestry systems withstand climate stress, maintain productivity, and deliver durable environmental and social benefits.
In smallholder and agroforestry landscapes, polygon mapping is not just about accuracy it is about capturing the reality of land use in a way that supports credible, lasting impact.
Digital Measurement, Reporting, and Verification (DMRV) systems rely on one foundational input: clean, spatially accurate land data. Polygon mapping provides that foundation by defining exactly where monitoring, measurement, and verification should occur.
Polygons act as the spatial anchor for DMRV. They tell the system which land parcels to monitor, measure, and include in reporting. Without polygons, DMRV platforms cannot reliably determine what area is in scope, making automated verification unreliable.
Polygon mapping enables seamless integration between multiple data sources:
Without clean polygon data, DMRV systems face fundamental limitations. Point-based or inconsistent mapping leads to misaligned satellite analysis, incorrect area calculations, and gaps between field data and modelled outcomes. This increases the risk of over- or under-reporting carbon, triggering verifier concerns, registry rejection, or buyer distrust. In short, DMRV cannot scale or be trusted without precise polygon boundaries.
TraceX Polygon Mapping Feature is built to make polygon mapping operational at scale, even across complex, multi-country landscapes.
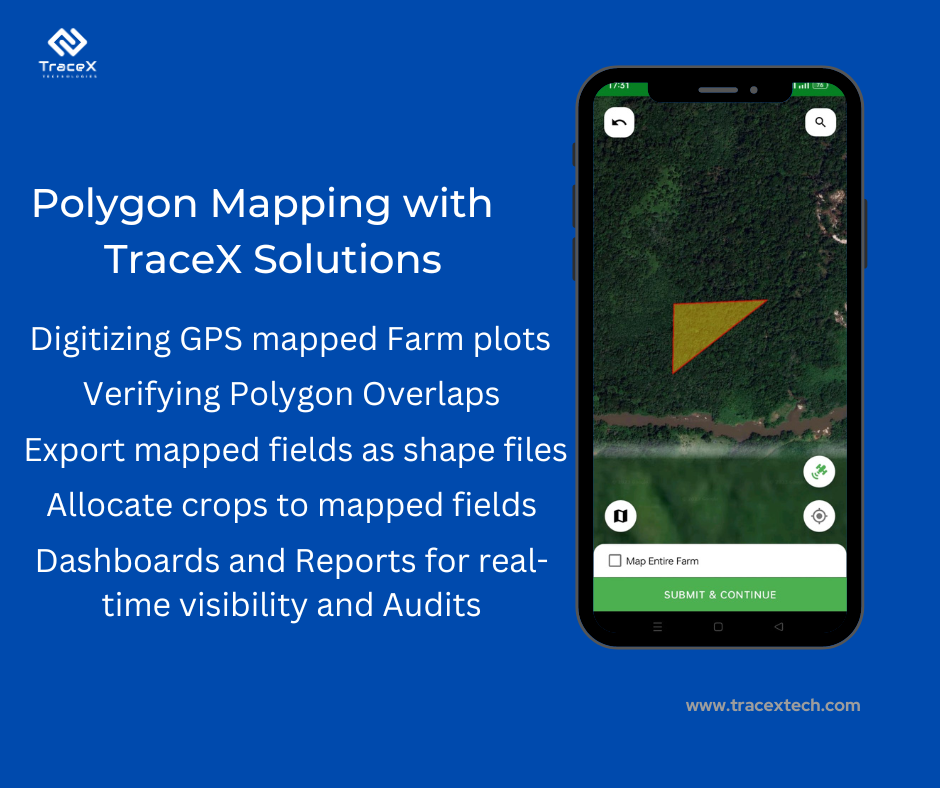
TraceX integrates polygon data directly with:
Designed for multi-country, multi-commodity programs, TraceX allows organizations to standardize polygon mapping, reduce verification risk, and move from fragmented land data to audit-ready carbon, compliance, and traceability outcomes.
Polygon Mapping for Carbon, Compliance, and Traceability is no longer a technical enhancement it is the foundation of credible land-based programs. As carbon markets mature, regulations like EUDR tighten, and supply chain scrutiny increases, organizations must move beyond approximate locations to precise, verifiable land boundaries. Polygon mapping enables accurate carbon accounting, defensible compliance, and end-to-end traceability by anchoring every claim to clearly defined plots. Companies that invest early in polygon-based mapping reduce verification risk, avoid costly rework, and build land data systems that scale across regions, commodities, and regulatory regimes.
Read our blog on Deforestation Risk Assessment under EUDR to understand how plot-level data and geospatial checks prevent blocked DDS submissions.
Explore our guide on DCF Sourcing and learn how companies operationalize deforestation-free commitments across complex agricultural supply chains.
Dive into Farm Mapping for Compliance to see how accurate geolocation and polygon mapping underpin EUDR, ESG reporting, and audit readiness.
Polygon mapping defines the exact boundaries of a land parcel using GPS coordinates, enabling accurate area measurement, spatial validation, and reliable verification for carbon, compliance, and traceability.
GPS points show location but not land area or boundaries. Without polygons, it is impossible to calculate carbon accurately, detect overlap, or prove land-use eligibility.
While EUDR requires plot-level geolocation, polygon mapping is the most defensible way to demonstrate deforestation-free sourcing, assess risk, and support Due Diligence Statements.
Polygons provide the spatial anchor for satellite monitoring, field data, and carbon models, enabling automated, scalable, and auditable digital MRV workflows.
Yes. With the right tools and validation, polygon mapping can accurately capture small, fragmented, and intercropped plots, including bunds and conservation features, at scale.