Quick summary: Explore the world of geospatial mapping with TraceX solutions. Unlock the potential of precise and data-driven farm management through advanced geospatial technology. Maximize efficiency, optimize resource allocation, and make informed decisions for your agricultural operations. Read our blog to learn more
From meeting sustainability standards to ensuring traceability across supply chains, the pressure is on for staying ahead of compliance regulations .And with regulations like the EU Deforestation Regulation (EUDR) tightening every year, failing to meet these requirements can lead to severe consequences—lost market access, fines, and damage to your brand’s reputation. Farm mapping is a game-changer that not only ensures your business meets regulatory demands but also helps you optimize your farm operations like never before.
Farm Mapping streamlines compliance, boost operational efficiency, and ensure sustainability Let’s explore how farm mapping solutions are turning compliance headaches into streamlined processes, while unlocking new levels of productivity.
Geospatial mapping is the process of creating visual representations of data related to geographic locations. This data can include information on topography, land use, v vegetation and soil composition. Geospatial mapping technologies use satellite imagery, GPS and other technologies to gather and analyse this data, which can then be used to make informed decisions.
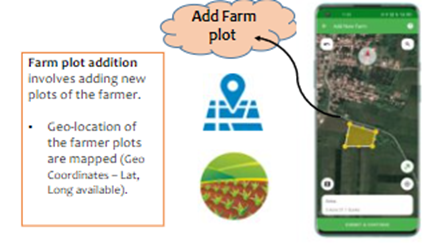
Geo-tagging and Polygon mapping are types of geospatial mapping. Geo-tagging involves attaching geographical data, such as latitude and longitude coordinates to digital content such as photos, videos and text messages. This allows the content to be organized and displayed based on its geographic location.
Polygon mapping is also known as vector mapping, that involves creating digital maps that use vector data to represent geographic features such as land boundaries, roads and buildings. This data stored as series of coordinates defines boundaries of the features, allowing the map to be displayed and manipulated at different scales and resolutions.
In GIS (Geographical Information System), vector data represents the information in three formats- points, lines and polygons. Polygons are used in GIS to measure the area and perimeter of a particular location. Polygons on a a map are commonly represented with different schemes and patterns for easier identification of data.
Polygon mapping is commonly used in GIS for a variety of applications, including land use, environmental management and natural resource conservation.
Farm mapping is a game-changer for agribusinesses aiming to streamline compliance. By mapping your fields and tracking key information like restricted zones, deforestation-free sourcing, organic practices, and carbon management, you’re not just staying compliant—you’re gaining a competitive edge. Farm mapping helps you meet these complex requirements quickly, efficiently, and accurately, so you can focus more on growing your business and less on paperwork.
Farm mapping is essential for enhancing agricultural productivity, sustainability, and resilience by enabling precise management, informed decision-making, and effective risk mitigation strategies.
Geotagging ie. Marking the latitude and longitude of farms is no longer enough. The use of GPS polygon mapping that traces the entire perimeter of a farm for increased transparency and traceability would provide that additional layer of accuracy and insight.
With the increasingly common use of geospatial information system in agriculture, polygon mapping is rapidly becoming important. Polygon mapping provides a number of advantages:
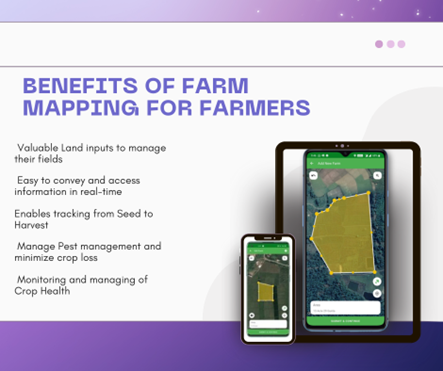
Farm mapping is a precision agriculture technique that allows farmers to create detailed maps of their land. These maps usually contain land boundaries, location of buildings, fences, water pipes located on a farm. Farmers can also record the crops planted in different sections of their fields and details of operations that were carried out in those fields. Farmers also use drones, weather monitoring stations, sensors and soil monitoring technology to record more detailed information about their land and crops.
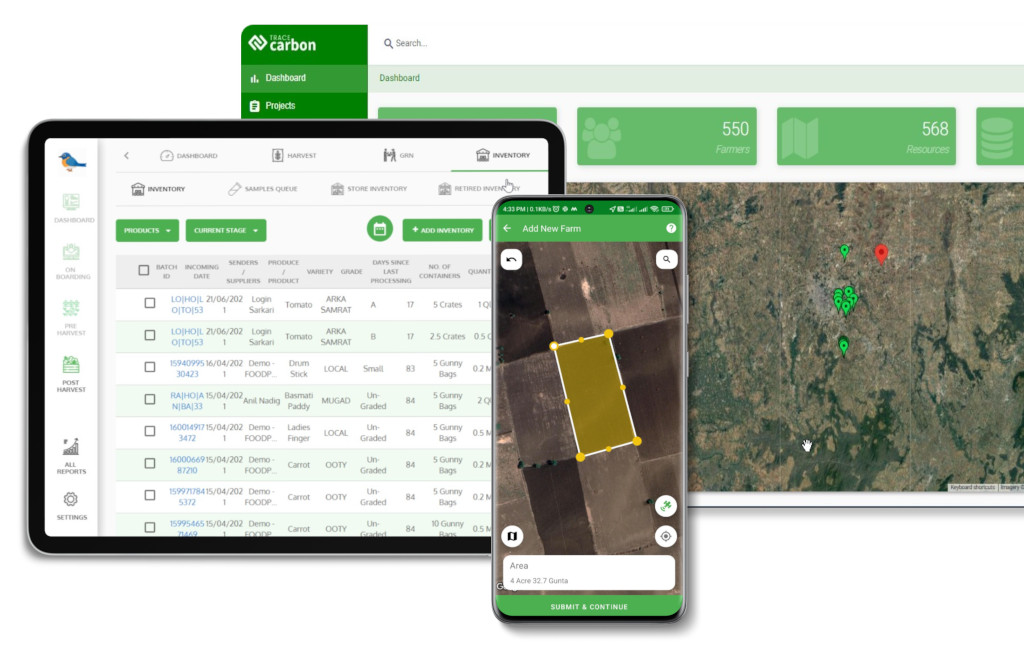
Geo-tagging of farms is an important requisite for farm management. It is an important tool for farmers and field officers to collect and analyse data about their operations. TraceX’s geo-mapping feature has enabled many enterprises and contract farmers to improve efficiency, increase yields and promote greater transparency and traceability in the agriculture value chains. It allows farmers to keep accurate records of their farm and crop activities. This is useful for tracking yields and satisfying regulatory compliance. It also allows farmers to collect and analyse location -based data over time. This helps to identify rends and patterns in crop growth and other farm operations to take informed decisions.
Boundary Overlap feature is of great importance in carbon offset projects where project area is of great significance. Most land sector projects require collection and reporting of geographic information which are specific to a project and are determined by geographic boundaries. Carbon offset projects demand accuracy on spatial measurements and avoidance of boundary overlaps. There could be requirements on differences in claimed area and area mapped.
The feature enforces restrictions on overlapping farms within the organization and the users receive reports on the percentage of overlap between farms
TraceX’s feature helps in validating land boundaries in carbon projects thereby satisfying requirements of carbon project developers and the verification bodies and finally in generation of quality carbon credits.
VNV Advisory, a leader in sustainable development, leveraged TraceX’s farm mapping platform to accurately validate land parcel boundaries for their carbon projects. This ensured precise tracking of land use, aiding in compliance with carbon offset standards and improving the overall credibility of their sustainability initiatives.
The Polygon Mapping feature traces the entire parameter of a farm for increased transparency and traceability that provides an additional layer of insight and vigilance. It gives an ability to verify that the crop is grown within the boundaries of the farm and not in forests or other natural ecosystems nearby. This level of accuracy ensures that commodity is being grown in deforestation-free area, thereby preventing commodity laundering and assuring consumers on a deforestation-free purchase of their products
Restricted Zones (Forest Areas): The feature automatically flags forest areas as restricted zones, in line with EUDR regulations.
Override with Custom Restricted Zones: Users can customize and override restricted zones based on specific organizational or regulatory requirements.
Deforesting Tracking (Remote Sensing): Utilizing remote sensing, the feature flags deforested lands post-2020, aiding in EUDR compliance.
Geo-fencing ensures the authenticity of farm plots, preventing unauthorized changes or manipulations and ensuring the accuracy of mapping. Enables plotting within 100m of plot.
Geofencing helps to validate mapping claims by ensuring that the physical location of mapped areas aligns with the designated boundaries.
Farm mapping plays a crucial role in helping agribusinesses document and track the conditions necessary for organic farming. By creating detailed, digital maps of farm areas, businesses can easily monitor and document key factors like soil quality, crop rotation practices, and the absence of synthetic chemicals— all of which are essential for organic certification.
Organic India, a leading agricultural enterprise specializing in organic farming, faced challenges in tracking and certifying its organic practices across multiple farm locations. The complexity of monitoring diverse farm conditions and ensuring consistent compliance with organic standards made certification and traceability difficult.
In the context of farm plots, generating files in these formats allows for the storage, visualization, analysis, and sharing of geographic data related to farm boundaries, field locations, soil types, crop types, and more. These files can be used for validation, audit, planning, and decision-making purposes in agriculture management systems.
TraceX enables the generation of standard geospatial files for validation, audit, and regulatory reporting.
To maintain a sustainable and deforestation-free supply chain, a large tire manufacturing company implemented GeoJSON mapping technology as a key part of its compliance strategy. This technology enabled accurate tracking and monitoring of farm boundaries, helping ensure adherence to environmental standards and deforestation-free sourcing.
Farm mapping solutions are more than just a tool—they’re a game-changer for agribusinesses striving for efficiency, compliance, and transparency. By leveraging advanced mapping technologies like GeoJSON and farm mapping platforms, you can streamline the complex processes of ensuring traceability, meeting regulatory requirements, and optimizing farm management. With features like deforestation monitoring and organic certification tracking, farm mapping can provide a clear, sustainable path forward for your business.
Don’t let compliance challenges slow you down. Embrace farm mapping to not only meet current regulations but also to future-proof your operations as the agricultural landscape evolves. Whether you’re navigating the complexities of the EU Deforestation Regulation (EUDR) or pursuing organic certification, farm mapping can help you stay ahead of the curve.
Farm mapping helps agribusinesses track land boundaries, monitor deforestation-free zones, and manage regulatory requirements for certifications like organic farming and carbon credits. It simplifies documentation and ensures transparency, reducing the risk of compliance violations.
Key features include geo-fencing for monitoring farm boundaries, traceability from farm to market, integration with environmental standards (e.g., deforestation-free sourcing), and support for organic and carbon certifications.
Farm mapping solutions provide a clear view of land parcels, crop patterns, and environmental data, enabling better decision-making. By automating compliance tracking and enhancing traceability, agribusinesses can reduce manual work, save time, and focus on improving productivity.